BI overview
BI is the build-your-own-report surface — when Reports doesn't have the pre-configured view you want, you come here, pick an area (Transactions / Campaigns / Membership / Connectivity), pick a subsection, and assemble a custom report by clicking fields from the left-hand list. Save the result as a Template so you can re-run it later. The most flexible — and most challenging — section in the help center.
This is the section to reach for when "the answer I need isn't in the Reports library." The trade-off is honest: BI is more powerful but you have to drive it yourself. The good news is that the workflow is the same regardless of which area you start from — once you've built one report you've effectively learned the whole section.
Where BI lives
Find it under BI in the left nav, just below Reports. Clicking it expands into the five areas the section covers:
- Transactions — sales, points & credits, and (coming) item affinity reporting.
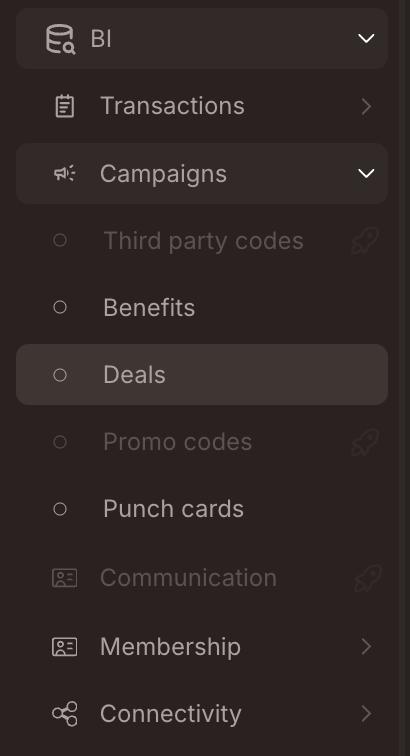
- Campaigns — performance reporting per campaign type (Benefits, Deals, Punch cards; some sub-areas not yet active).
- Communication — coming soon. Greyed in the menu with the inactive-area marker.
- Membership — member details, "did not purchase" segmentation, friend referrals (coming).
- Connectivity — Submit events.
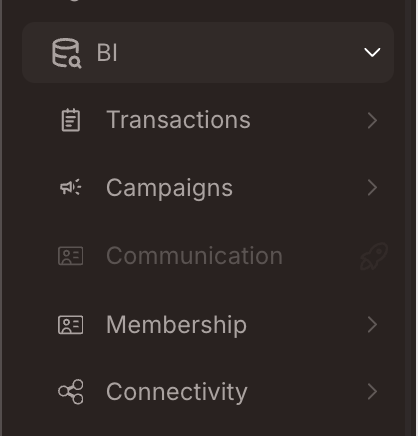
Items shown greyed-out in the menu are inactive — coming soon. They show in the menu so you know what's planned, but clicking them does nothing today.
Each area expands to a list of subsections. Pick one to enter the report builder.
How to build a report
Once you've picked an area + subsection, you land in the report builder — a three-panel layout:
- Fields (left) — every dimension and measure available for this subsection, organised into collapsible groups. The grey labels are dimensions (group-by columns); the orange labels are measures (numerical aggregates).
- Filters (top-right) — rows that constrain the data the report runs against.
- Data (bottom-right) — the result table, empty until you click Run.
Every report you'll ever build follows the same five-step pattern:
1. Add fields to the report
There are two ways to add a field from the Fields panel, and the difference matters:
- Click the field name → the field becomes a column in the result. Use this when you want the field's values in the output (e.g. add Month of Purchase as a column to break the report down by month).
- Click the filter icon next to the field → the field becomes a filter row at the top, which constrains the data the report runs against. Use this when you want to narrow the population (e.g. First Purchase Date is in the year 2026 to look only at members who became members this year).
The screenshot below shows the second flow: clicking the filter icon next to First Purchase Date in the Fields panel adds a First Purchase Date row to the Filters panel above. The blue arrow traces the action.
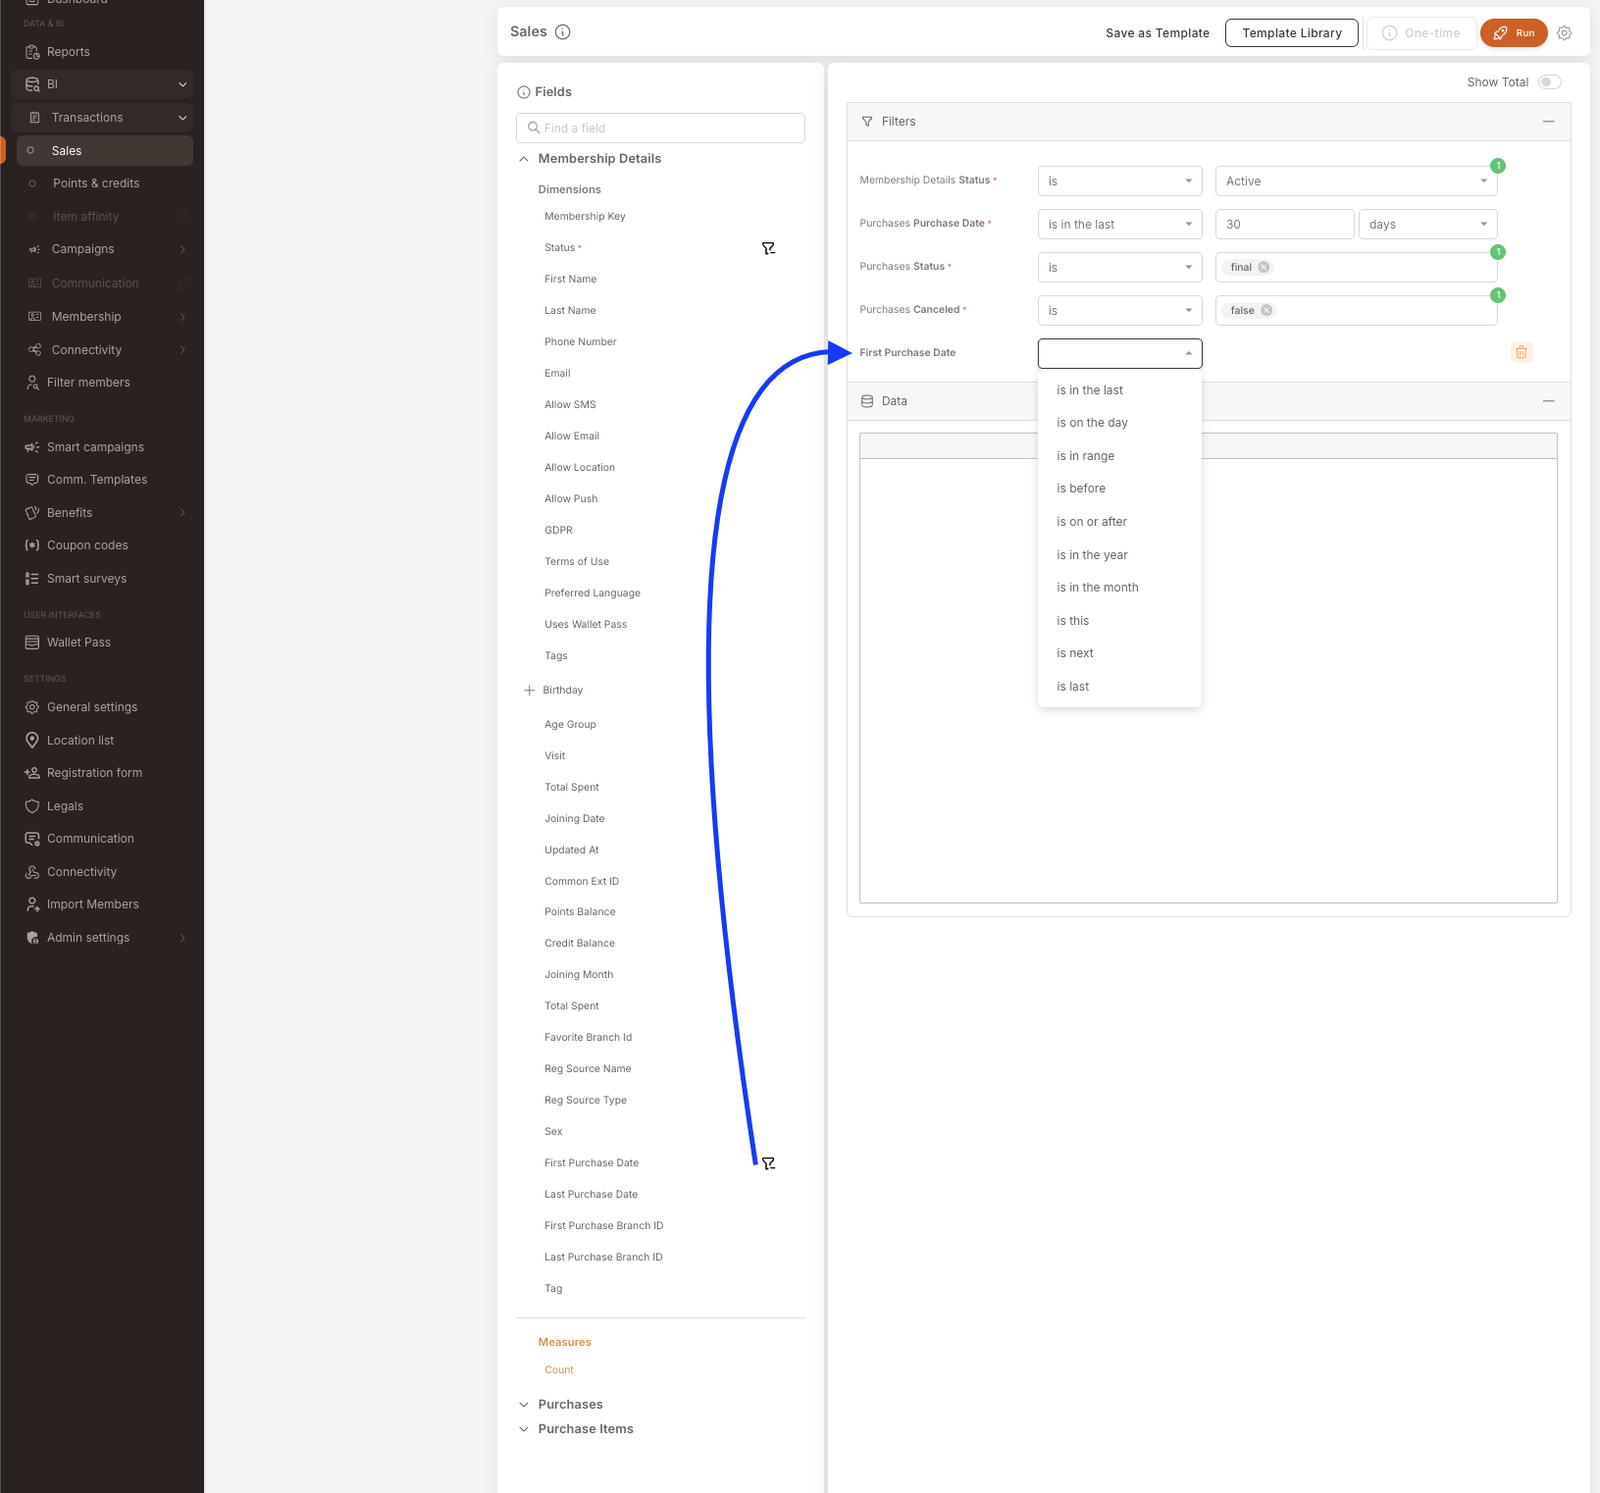
Required fields are marked with a red asterisk (*). They must be added — typically as filters — before the report can run. Most subsections have a couple of required filters (status flags that exclude cancelled / non-final transactions, etc.).
2. Set the filter values
Each filter row has three parts: the field name, the operator (is, is in the year, is in the last [N] [days], etc.), and the value(s). Multi-value filters show a small numbered badge (e.g. ① in green) for the count of selected values.
The same filter syntax is used everywhere else in the management panel — once you've used Filter members or Reports, the BI filter UI will feel familiar.
3. Pick measures
Measures (the orange labels in the Fields panel) are what the report actually reports. Add at least one — Sales (Sum), Sales by Members (Sum), Count, Quantity, etc. The measure's values fill the data cells; the dimensions you added define which rows.
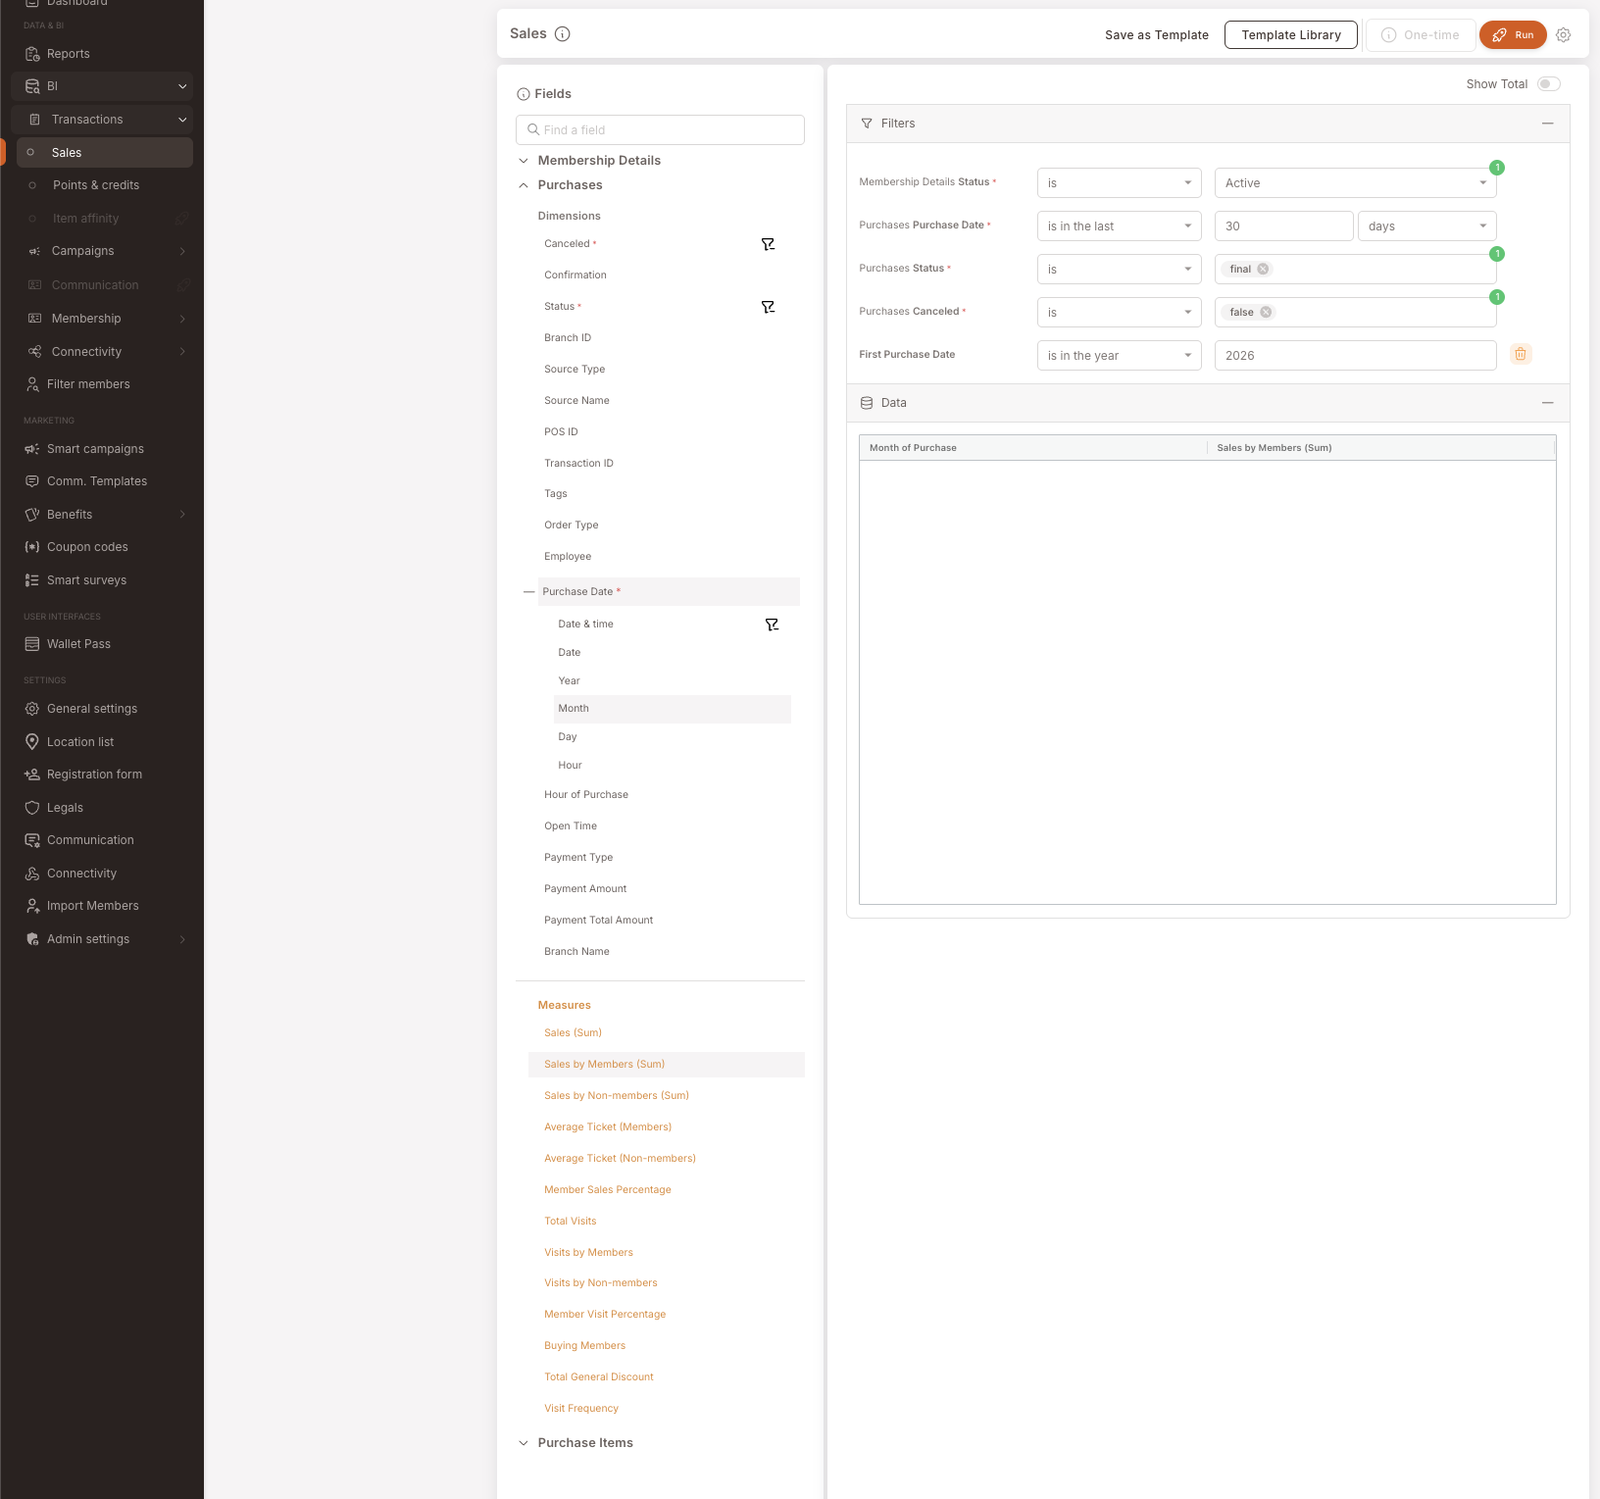
The example screenshot below shows the worked Sales report at this stage: filters are set (member status Active, purchases in 2026, transaction status final, not cancelled, members whose first purchase was in 2026), the Purchases group is expanded showing both its dimensions and measures, and Sales by Members (Sum) is selected as the headline measure. Month under Purchase Date is added as the row-grouping dimension.
4. Run
Click the orange Run button at the top right. The Data panel populates with the result table. Each row corresponds to a unique combination of dimension values (so a Month dimension produces one row per month); each cell holds the measure value for that row.
Toggle Show Total in the top-right of the Data panel to add a totals row at the bottom — easy to forget but often what you actually wanted.
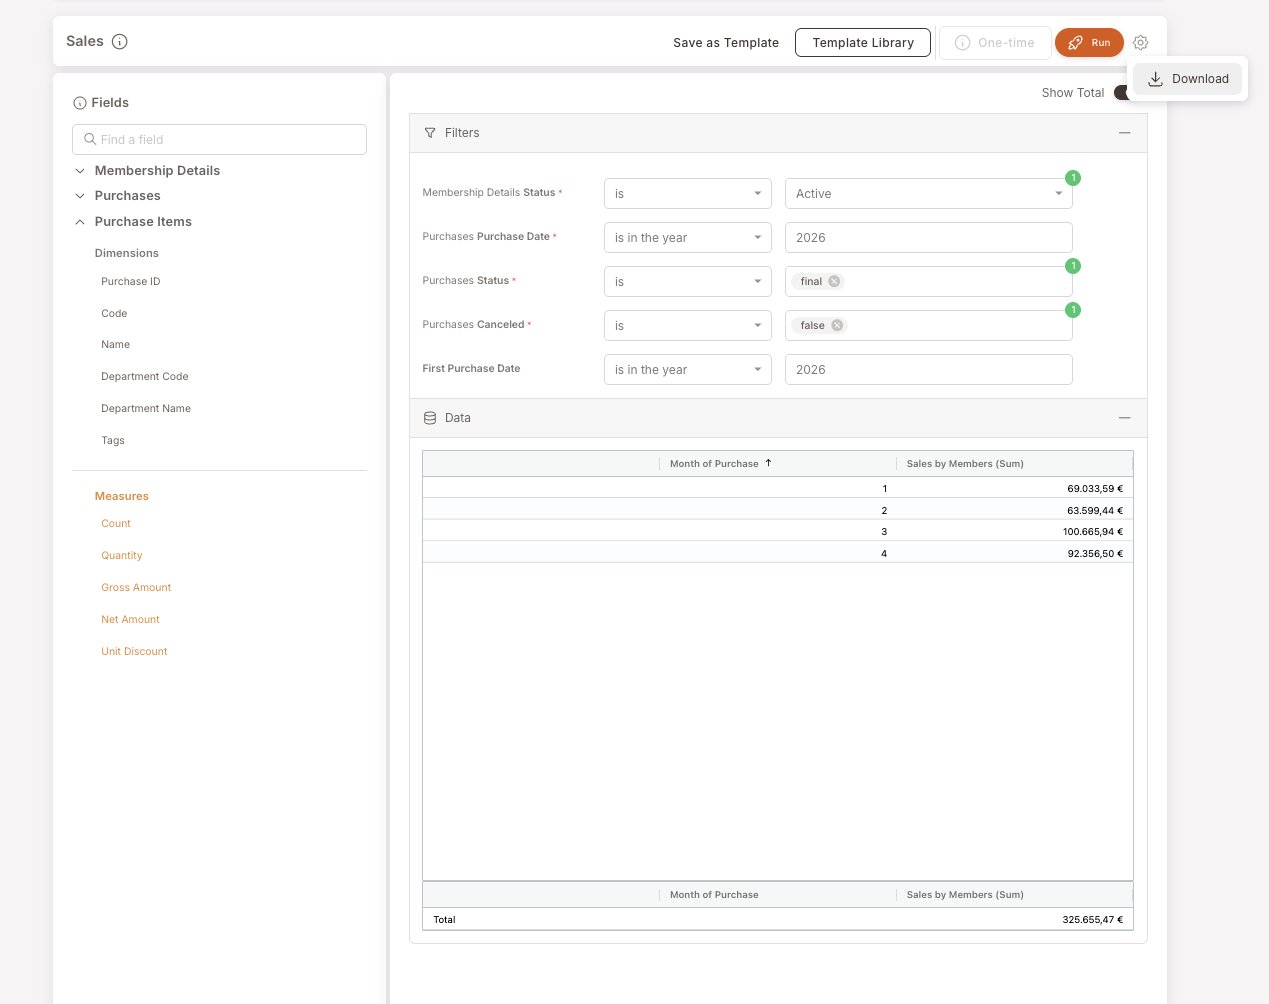
The example reads: "Sales by members per month for 2026, restricted to members whose first purchase was in 2026." The dimension is Month, the measure is Sales by Members (Sum), and the filters narrow to Active members whose First Purchase Date was in 2026, with transactions in 2026 and final / non-cancelled.
5. Download or save
Two persistence paths:
- Download as CSV. Click the gear icon in the top-right and pick Download from the dropdown. Same flow as Reports → Downloading a report as CSV — see that page for the screenshot of the dropdown.
- Save as Template. Click Save as Template in the header to save the current report configuration. It joins the Template Library (button next to it). Re-open the saved template later to re-run the report — same fields, same filters, fresh data.
The Template Library is a per-tenant store — every report you save becomes available to everyone with BI access in your organisation, not just to you. For shared dashboards or recurring monthly reviews, save once, anyone can re-run.
When to use BI vs Reports vs Filter members
Three surfaces ask similar-looking questions; each is right for a different job:
- Reports — pre-configured views. Pick one, set a filter, get the answer. Fastest path; limited to the patterns the library covers.
- BI (this section) — build-your-own. Slower to set up, but answers any question the data can answer. The right surface when Reports doesn't have what you need.
- Filter members — audience builder. Returns a list of members; primary action is Export to CSV or + One-time action. Different shape — Reports/BI return data, Filter members returns people.
BI and Filter members do not refresh on the same cadence. BI is closer to live; Filter members runs against a slower-refreshing snapshot. If you need the most recent activity (e.g. "who spent today?"), reach for BI; if a few hours of lag is fine and you want a member list to act on, Filter members is simpler.
Gotchas
5 things to watch for when working in BI
- Dimensions and Measures behave differently. A dimension defines rows (group-by); a measure defines cell values (aggregates). Adding only dimensions gives you a unique-row list. Adding only a measure gives you one row with the grand total. Most reports want both: pick a few dimensions to slice by, plus the measures you want to see for each slice.
- Required fields (
*) must be added before Run will work. They're typically status flags that exclude cancelled or non-final transactions — don't skip them or your report will include data you didn't mean to count. - Show Total is off by default. It's the toggle you forget. If your report's headline number is the grand total, flip Show Total on.
- Save as Template captures the configuration, not the data. When you re-open a saved template, the filters, dimensions, and measures are restored, but the data is re-queried fresh. So a "Sales for 2026" template will keep working into 2027 as long as the filter is is in the year 2026 — but if it was is in the last 30 days, the result will rotate forward as time passes.
- Field names in the lists are still being revised. Some field names in the Fields panel may be confusingly named or duplicated across groups (you may notice Total Spent appearing twice on Membership Details, for example). The list is being cleaned up; if a field name doesn't behave the way you'd expect, try a couple of nearby alternatives.