Reports overview
Reports is a library of pre-configured, ready-to-run analytics views — no BI skill required, no SQL, no custom dashboard build. Pick a report from the library, set a few filters (typically a date range and one or two extras), hit Run, and the answer appears as a table you can read on screen or export. The library expands over time as new report patterns get requested.
This is the section to reach for when you have a question about the program — who's spending the most this month?, how is my Happy Hour discount actually performing?, which branches lead in member visits? — and you don't want to (or can't) build a custom dashboard to answer it. Reports does the analytical work upfront; you just configure the filter and read the result.
Who Reports are for
The Reports library is especially valuable for businesses without in-house BI. Restaurants, cafés, small chains — operators who know their business inside out but don't have a data analyst on payroll. Instead of waiting on a partner to build a custom report, you open the library, pick the closest match, set the filter, and get the answer in a few clicks.
The library also serves teams that do have BI capacity, as a quick-answer surface for the questions that come up daily — did our Cash Back campaign drive any redemptions yesterday?, how many members joined last week? — where spinning up a custom analysis is overkill.
How the library is laid out
Reports lives in the left nav under Data & BI → Reports. Clicking it opens the report list. Clicking any report card opens a detail screen — the report's filter panel and (once you hit Run) its data table.
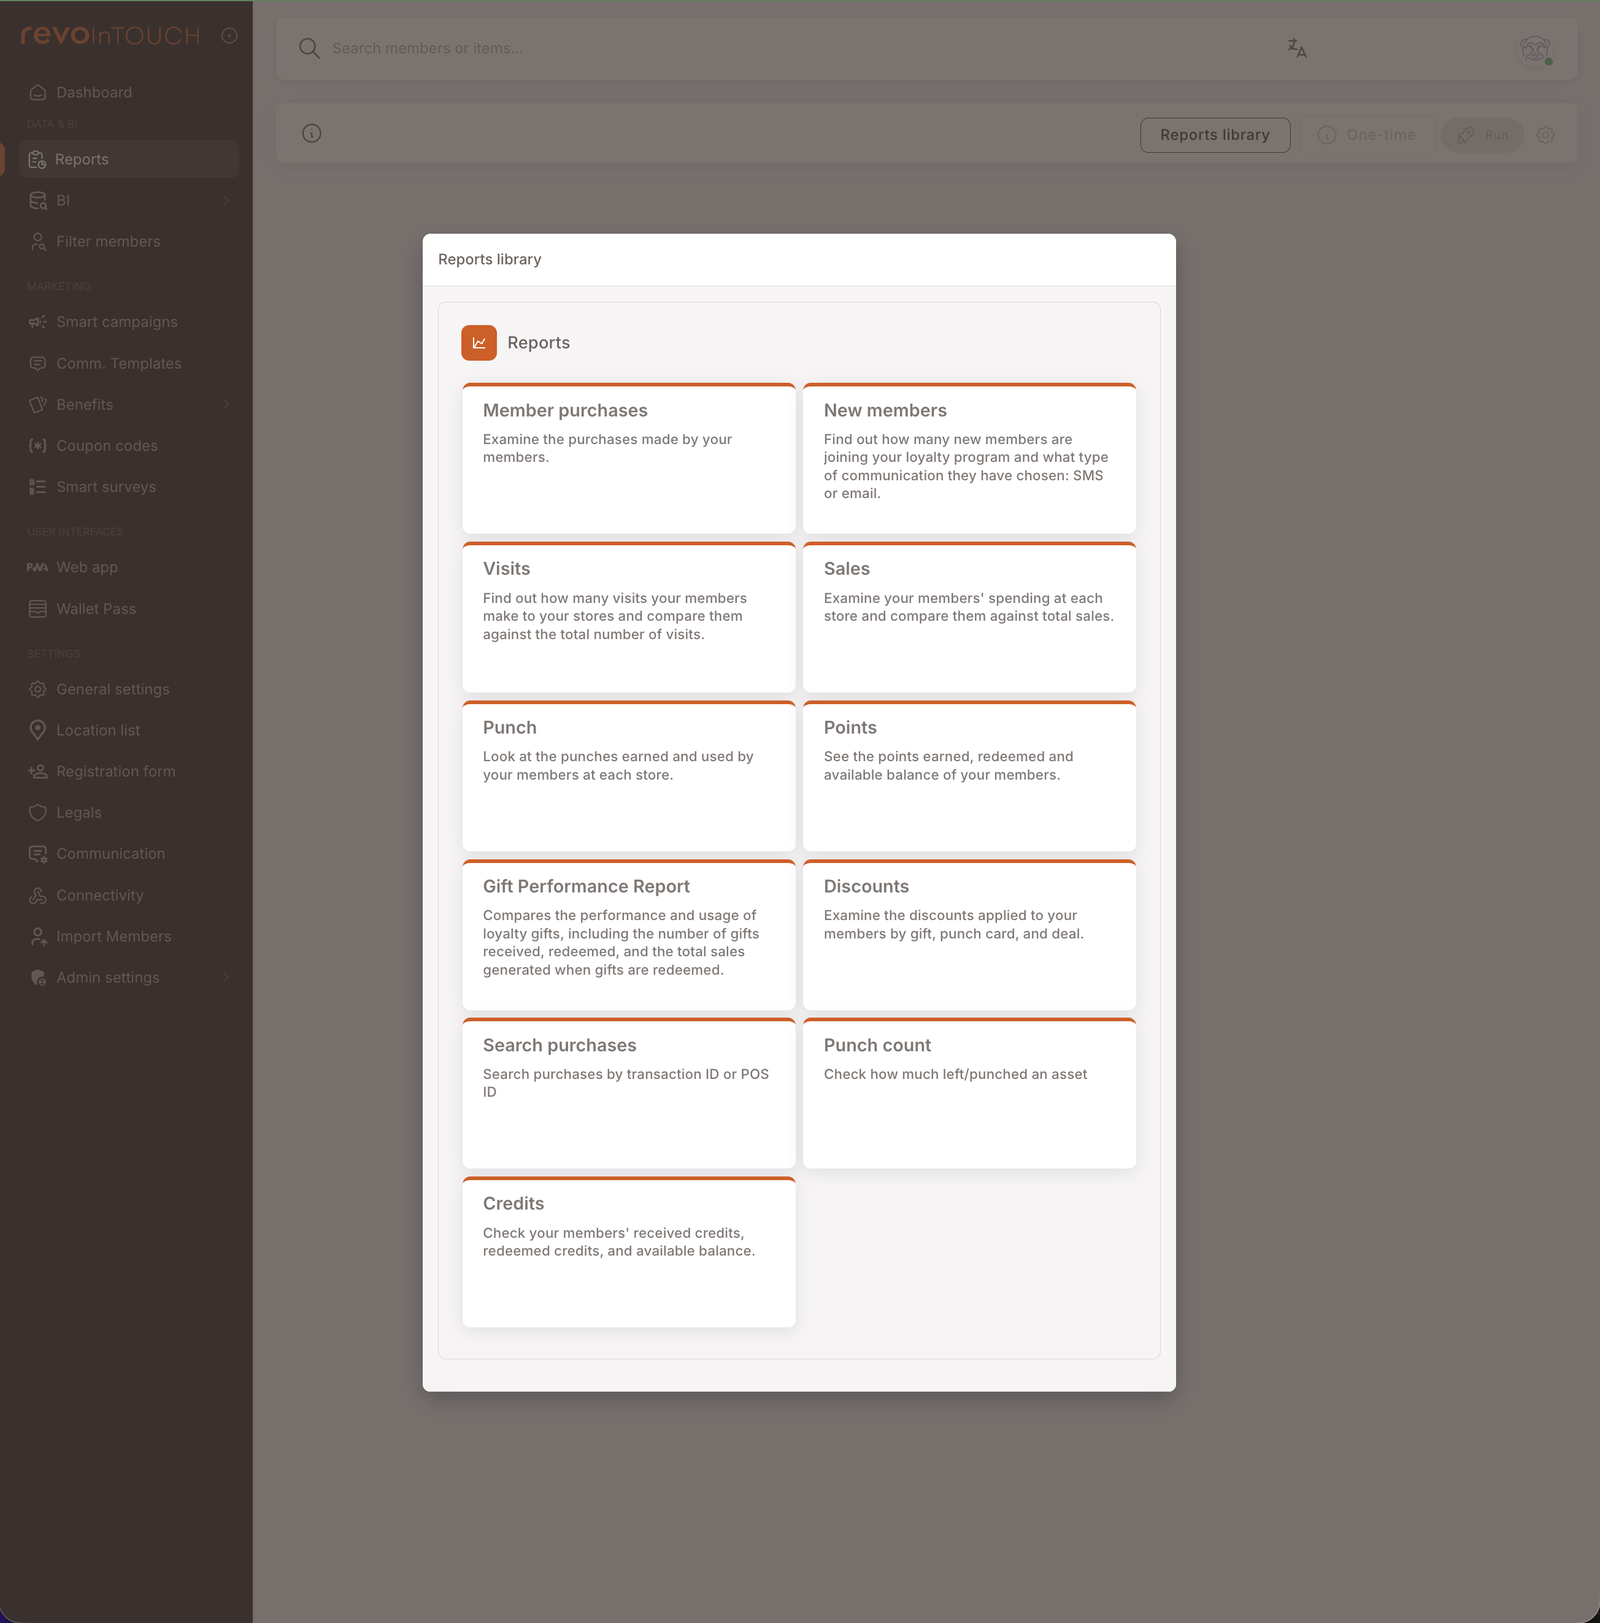
The 11 reports currently in the library, grouped by what they help you do:
- Membership health — New members, Member purchases, Credits, Punch count, Points.
- Sales and visits aggregates — Sales, Visits, Discounts, Punch.
- Campaign performance — Gift Performance Report.
- Lookup / audit — Search purchases.
The library expands as new patterns are requested — if you find yourself routinely running a workflow the existing library doesn't cover, that's a candidate for a new report.
How to read a report
Every report shares the same shape:
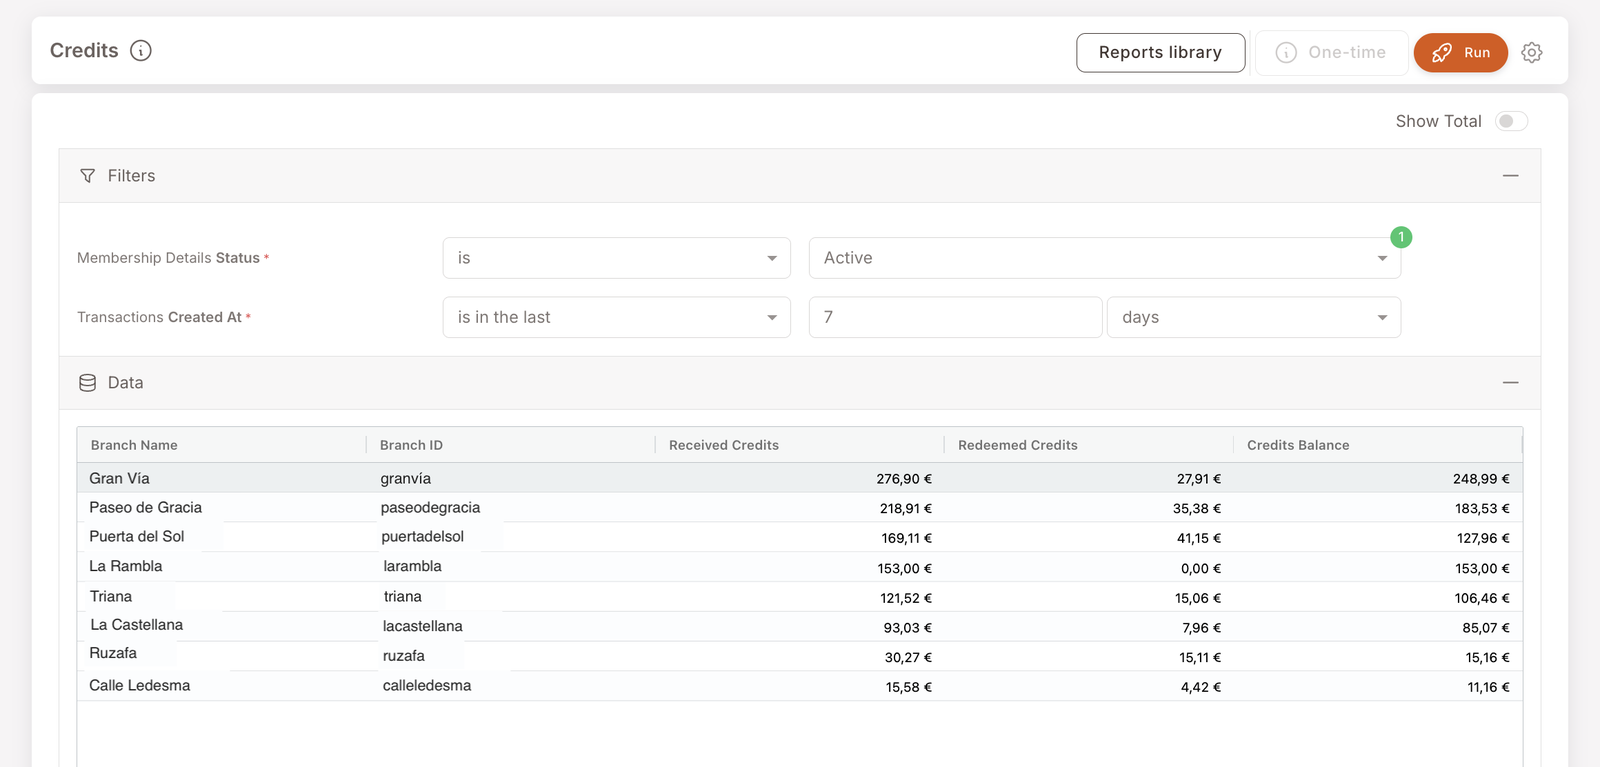
- Top bar. Report name on the left, Reports library button (returns to the list), One-time button (push the report's audience to a Future Campaign — see below), Run button (the orange CTA that executes the filter), and a settings gear (which exposes the Download option for CSV export).
- Filters panel. Stacked filter rows. Required filters are marked with a red asterisk (typically a date range; some reports require an asset or campaign too). Each row has a field, an operator, and a value — the same syntax used everywhere else in the management panel.
- Data panel. Empty until you hit Run. Once populated, a table (or a small aggregate grid) with the result. A Show Total toggle in the top-right adds a totals row at the bottom of tabular reports.
You can collapse the Filters or Data panels using the − icon on each section header.
The One-time button — turn a report into a campaign
The One-time button at the top of every report links the report to a Future Campaign. When the report's result is member-identified (i.e. each row is a specific member — Member purchases, Punch count, Search purchases, etc.), clicking One-time opens the Future Campaign wizard with that audience pre-filled. You skip Filter members entirely and go straight from "the report tells me who" to "send these members a one-shot SMS / email / asset / credit."
For aggregated reports (Sales by branch, Visits by branch, New members count), the button doesn't do anything useful — the result isn't a list of members.
The One-time button is currently shown as inactive in the UI but is being wired up imminently. Once active, it's expected to be the primary path between "this report shows me a segment that needs attention" and "send them something."
Downloading a report as CSV
Every report can be exported. Click the settings gear in the top-right of the report header to open a small menu with a Download option. Click it to download the current result set as a CSV file — same data you see in the table on screen.
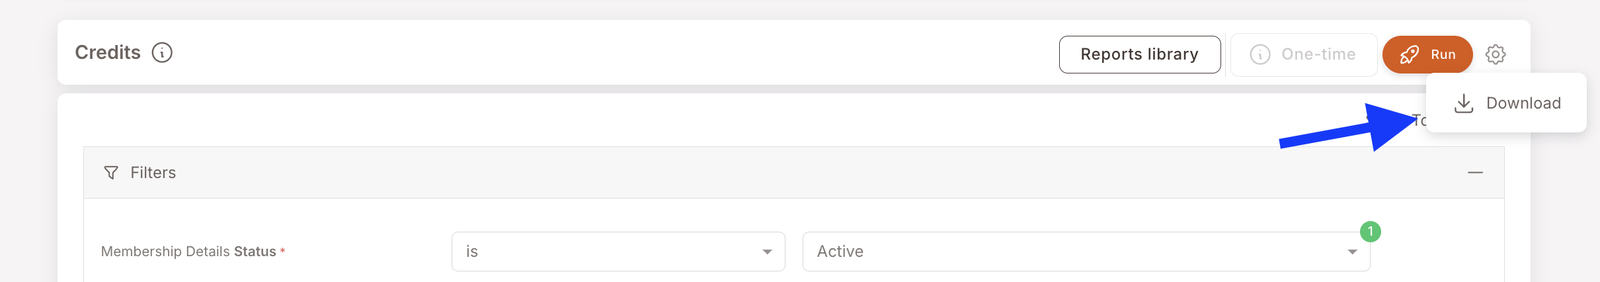
The export reflects the filters currently set — change the filter, hit Run, then Download to get the updated CSV. Useful for offline analysis, sharing with a partner system, or feeding a tool the management panel doesn't natively integrate with.
Common filter patterns
A few filter patterns recur across the library and are worth knowing once:
- Date range filters — usually expressed as is in the last [N] [days/weeks/months] (rolling) or is in range [start date] [end date] (fixed). Both behave intuitively. Most reports require a date filter.
- Multi-value filters — fields like Campaign Name, Asset ID, Branch ID, Member Tags take operator is one of (or contains any of) plus one or more values from a picker. A small numbered badge (e.g. ① in green) shows how many values are currently selected.
- Status filters — fields like Membership Status, Campaigns Status with operator is + a single value (typically Active).
The shape is the same as the audience filters on Smart Campaigns and the rows in Filter members, so once you've used one filter UI in the product, you've used them all.
When to use Reports vs Filter members vs Smart Campaigns
Three surfaces ask similar-looking questions; each is right for a different job:
- Reports — "Tell me what happened." Answers a specific business question with aggregated or row-level data; result is a table you read or export.
- Filter members — "Find me members who match this." Returns a list of members; primary action is Export to CSV or + One-time action (push a one-shot campaign to that audience).
- Smart Campaigns — "Make this happen automatically." Configure a Rule, Deal, Future Campaign, or Scheduled campaign that fires on its own.
The same data ends up in all three surfaces; the question is what you want to do with it.